
Ich hätte schwören können, dass es zu den Abstürzen keine Bluescreens gab. Aber die Suche heute ergab tatsächlich einen Treffer. Der Bericht ist vom zweiten Absturz, so etwa 3 Tage nachdem ich Windows neu aufgesetzt hatte.
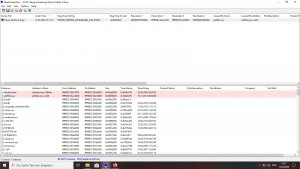
Es tut sich was. Glaube ich. Ich fand den Hinweis, dass ich den Driver Verifier von Windows benutzen könnte, um einen Bluescreen zu provozieren und so den fehlerhaften Treiber zu finden. Das Windows Debugging Tool zum Auswerten der Bluescreens spinnt aber derzeit etwas. Aber hier ist schon mal die Auswertung von BlueScreenView.
Ich konnte den Bluescreen reproduzieren, indem ich den Verifier mit und ohne automatisch aktiviertem Peerblock laufen ließ. Mit Peerblock spuckte er gleich beim starten von Windows einen Bluescreen aus. Ohne nicht. Auch die Intervale und die Regelmässigkeit der Abstürze passen ungefähr. Sie decken sich in etwa mit Peerblocks automatischer Suche nach Updates, alle paar Tage.
Allerdings brachte der Verifier Peerblock auch zum Absturz, nachdem ich die Update-Funktion deaktiviert hatte. Mag sein, dass es sich nach einem der letzten Updates überhaupt nicht mehr mit Windows verträgt. Ich probiere es jetzt erstmal eine Weile ganz ohne Peerblock und schaue, wie es läuft.
Wär' super, wenn es wirklich nur daran gelegen hat.
Microsoft (R) Windows Debugger Version 6.10.0003.233 X86
Copyright (c) Microsoft Corporation. All rights reserved.
Loading Dump File [D:\PC-Zeug\minidumps\Minidump.dmp]
Mini Kernel Dump File: Only registers and stack trace are available
Symbol search path is: SRV*C:\SymPath*http://msdl.microsoft.com/download/symbols
Executable search path is:
Windows 7 Kernel Version 18362 MP (12 procs) Free x64
Product: WinNt, suite: TerminalServer SingleUserTS
Built by: 18362.1.amd64fre.19h1_release.190318-1202
Machine Name:
Kernel base = 0xfffff800`81400000 PsLoadedModuleList = 0xfffff800`81848130
Debug session time: Tue Jan 14 17:07:29.987 2020 (GMT+1)
System Uptime: 0 days 0:00:42.641
Loading Kernel Symbols
...............................................................
................................................................
.........................................
Loading User Symbols
Loading unloaded module list
........
*******************************************************************************
* *
* Bugcheck Analysis *
* *
*******************************************************************************
Use !analyze -v to get detailed debugging information.
BugCheck 3B, {c000001d, fffff80083210f44, ffff84892d012fc0, 0}
Probably caused by : memory_corruption
Followup: memory_corruption
---------
2: kd> !analyze -v
*******************************************************************************
* *
* Bugcheck Analysis *
* *
*******************************************************************************
SYSTEM_SERVICE_EXCEPTION (3b)
An exception happened while executing a system service routine.
Arguments:
Arg1: 00000000c000001d, Exception code that caused the bugcheck
Arg2: fffff80083210f44, Address of the exception record for the exception that caused the bugcheck
Arg3: ffff84892d012fc0, Address of the context record for the exception that caused the bugcheck
Arg4: 0000000000000000, zero.
Debugging Details:
------------------
EXCEPTION_CODE: (NTSTATUS) 0xc000001d - {AUSNAHME} Ung ltige Anweisung Es wurde versucht, eine ung ltige Anweisung auszuf hren.
FAULTING_IP:
Ntfs!NtfsReferenceMftView+24
fffff800`83210f44 c644242000 mov byte ptr [rsp+20h],0
CONTEXT: ffff84892d012fc0 -- (.cxr 0xffff84892d012fc0)
rax=0000000000000158 rbx=ffffa30376fe3180 rcx=ffffa30376fe3180
rdx=ffff84892d013b58 rsi=ffff84892d013b58 rdi=ffffa30376fe4e20
rip=fffff80083210f44 rsp=ffff84892d0139b0 rbp=ffff84892d014430
r8=0000000000000008 r9=0000000000000000 r10=fffff80081441100
r11=ffff84892d013950 r12=ffffb90342e695a0 r13=ffffb90342e695a0
r14=0000000000000000 r15=ffffa30376fe3180
iopl=0 nv up ei ng nz na pe nc
cs=0010 ss=0018 ds=002b es=002b fs=0053 gs=002b efl=00050282
Ntfs!NtfsReferenceMftView+0x24:
fffff800`83210f44 c644242000 mov byte ptr [rsp+20h],0 ss:0018:ffff8489`2d0139d0=d5
Resetting default scope
DEFAULT_BUCKET_ID: CODE_CORRUPTION
BUGCHECK_STR: 0x3B
PROCESS_NAME: firefox.exe
CURRENT_IRQL: 0
LAST_CONTROL_TRANSFER: from 0000000000000000 to fffff80083210f44
STACK_TEXT:
ffff8489`2d0139b0 00000000`00000000 : 00000000`00000000 00000000`00000000 00000000`00000000 00000000`00000000 : Ntfs!NtfsReferenceMftView+0x24
CHKIMG_EXTENSION: !chkimg -lo 50 -d !win32kbase
ffffdd4995243f99-ffffdd4995243f9e 6 bytes - win32kbase!DirectComposition::CAnimationMarshaler::SetReferenceProperty+49
[ ff 15 11 28 1a 00:e8 02 13 21 00 90 ]
ffffdd4995244009-ffffdd499524400a 2 bytes - win32kbase!SfmSignalTokenEvent+19 (+0x70)
[ 48 ff:4c 8b ]
ffffdd4995244010-ffffdd4995244013 4 bytes - win32kbase!SfmSignalTokenEvent+20 (+0x07)
[ 0f 1f 44 00:e8 0b 14 21 ]
ffffdd4995245195-ffffdd4995245196 2 bytes - win32kbase!GreSfmDwmShutdown+35 (+0x1185)
[ 48 ff:4c 8b ]
ffffdd499524519c-ffffdd499524519f 4 bytes - win32kbase!GreSfmDwmShutdown+3c (+0x07)
[ 0f 1f 44 00:e8 7f 02 21 ]
ffffdd49952451a5-ffffdd49952451a6 2 bytes - win32kbase!GreSfmDwmShutdown+45 (+0x09)
[ 48 ff:4c 8b ]
ffffdd49952451ac-ffffdd49952451af 4 bytes - win32kbase!GreSfmDwmShutdown+4c (+0x07)
[ 0f 1f 44 00:e8 6f 02 21 ]
24 errors : !win32kbase (ffffdd4995243f99-ffffdd49952451af)
MODULE_NAME: memory_corruption
IMAGE_NAME: memory_corruption
FOLLOWUP_NAME: memory_corruption
DEBUG_FLR_IMAGE_TIMESTAMP: 0
MEMORY_CORRUPTOR: LARGE
STACK_COMMAND: .cxr 0xffff84892d012fc0 ; kb
FAILURE_BUCKET_ID: X64_MEMORY_CORRUPTION_LARGE
BUCKET_ID: X64_MEMORY_CORRUPTION_LARGE
Followup: memory_corruption
---------
Post automatically merged:
Es tut sich was. Glaube ich. Ich fand den Hinweis, dass ich den Driver Verifier von Windows benutzen könnte, um einen Bluescreen zu provozieren und so den fehlerhaften Treiber zu finden. Das Windows Debugging Tool zum Auswerten der Bluescreens spinnt aber derzeit etwas. Aber hier ist schon mal die Auswertung von BlueScreenView.
Ich konnte den Bluescreen reproduzieren, indem ich den Verifier mit und ohne automatisch aktiviertem Peerblock laufen ließ. Mit Peerblock spuckte er gleich beim starten von Windows einen Bluescreen aus. Ohne nicht. Auch die Intervale und die Regelmässigkeit der Abstürze passen ungefähr. Sie decken sich in etwa mit Peerblocks automatischer Suche nach Updates, alle paar Tage.
Allerdings brachte der Verifier Peerblock auch zum Absturz, nachdem ich die Update-Funktion deaktiviert hatte. Mag sein, dass es sich nach einem der letzten Updates überhaupt nicht mehr mit Windows verträgt. Ich probiere es jetzt erstmal eine Weile ganz ohne Peerblock und schaue, wie es läuft.
Wär' super, wenn es wirklich nur daran gelegen hat.
Anhänge
-
 494,3 KB Aufrufe: 6
Zuletzt bearbeitet:


")

")